At Rs 50,000/month, Amazon Ads is estimated to return 5.6x ROAS — about 188 conversions vs 13 on LinkedIn Ads. Benchmarks are illustrative; your real numbers depend on offer and creative.
| Compare | GGoogle Ads#3 | MMeta Ads#2 | aAmazon AdsBest ROAS | inLinkedIn Ads#4 |
|---|---|---|---|---|
| At a glance | ||||
| Estimated ROASRevenue per Rs spent | 1.6x | 2.0x | 5.6x | 0.4x |
| Conversions / month | 54 | 67 | 188 | 13 |
| Cost per conversion | Rs 921 | Rs 750 | Rs 267 | Rs 3,750 |
| Best for | High-intent search demand | Reach, retargeting and discovery | Ready-to-buy product shoppers | B2B decision-makers |
| Strengths | — | Most clicks | Best estimated ROASLowest cost per lead | — |
| Estimated monthly volume | ||||
| Clicks | 1,429 | 4,167 | 2,500 | 556 |
| Conversions | 54 | 67 | 188 | 13 |
| Revenue | Rs 81,429 | Rs 1,00,000 | Rs 2,81,250 | Rs 20,000 |
| Benchmarks (illustrative) | ||||
| Avg cost per click | Rs 35 | Rs 12 | Rs 20 | Rs 90 |
| Conversion rate | 3.8% | 1.6% | 7.5% | 2.4% |
Cost-per-click and conversion-rate benchmarks are illustrative India estimates and vary widely by industry, offer, creative and account quality — treat the ranking as directional, not a guarantee. The best platform also depends on your objective (search intent vs reach vs B2B), not ROAS alone. Calculated in your browser; nothing is sent or stored.
How to use this comparison
From budget to the channel that returns the most
The best platform depends on your objective and offer, not just the numbers. Here is how to read the comparison and choose where your budget works hardest.
- Step 1: Enter your budget and order value
Add your planned monthly ad budget and your average order or lead value. The tool estimates clicks, conversions, cost per lead and ROAS for each platform instantly, in your browser.
- Step 2: Pick the platforms you are weighing
Toggle the ad platforms you are considering. The comparison recomputes so you only weigh the channels that fit your business and objective.
- Step 3: Read the ROAS and cost-per-lead rows
These are the numbers that decide efficiency. The highlighted column is estimated to return the most revenue per rupee for your inputs, with cost per lead alongside it.
- Step 4: Match it to your objective
ROAS is not the only lens. If you need reach or B2B decision-makers, read the Best-for row too. The right platform depends on the job, not the benchmark alone.
- Step 5: Confirm with a real test
Benchmarks are directional. Run a small test campaign on your top one or two platforms with real creative before you commit the full budget, then scale what works.

Get your free proposal
Tell us where you are and what you want to achieve. We reply within one business day with a clear plan and a quote.

PAID MEDIA
What decides your best-performing ad platform
Six factors that move the winner from one channel to another.
Search intent vs demand generation
Google captures people already searching for what you sell; Meta creates demand you did not have yet. The best platform depends on whether you are harvesting intent or building it.
Budget efficiency
A lower cost per click is not automatically cheaper leads. What matters is cost per conversion, which combines CPC with how well that platform's traffic actually converts for your offer.
Conversion quality, not clicks
Clicks are vanity. Amazon shoppers are ready to buy, LinkedIn clicks are fewer but higher-value B2B. Compare on conversions and revenue, not traffic volume.
Audience and targeting
Each platform's targeting strength differs: keywords on Google, interests and lookalikes on Meta, purchase behaviour on Amazon, job title and company on LinkedIn. Match it to who you sell to.
Objective fit
Awareness, leads and sales are not the same job. A platform that wins on ROAS for e-commerce can be the wrong pick for B2B lead generation. Pick for your objective first.
Creative and offer
The single biggest swing in results is your creative and offer, not the platform. Strong creative can beat these benchmarks; weak creative underperforms them. Test before you scale.
Paid-media services we provide
How Dcrayons plans, builds and scales profitable campaigns across search, social and marketplaces.

Media planning and channel mix
We plan the right split across Google, Meta, Amazon and LinkedIn for your objective and budget, so every rupee goes where it performs.

Campaign build and management
Account structure, keywords, audiences, bids and budgets built and managed to a target cost per lead or ROAS, not left on autopilot.

Creative and landing pages
The biggest lever in paid media. We produce ad creative and conversion-focused landing pages so your spend actually converts.
Tracking and reporting
Proper conversion tracking and a weekly readout tied to ROAS and cost per lead, so you always know what each channel returns.
Brands we run paid media for
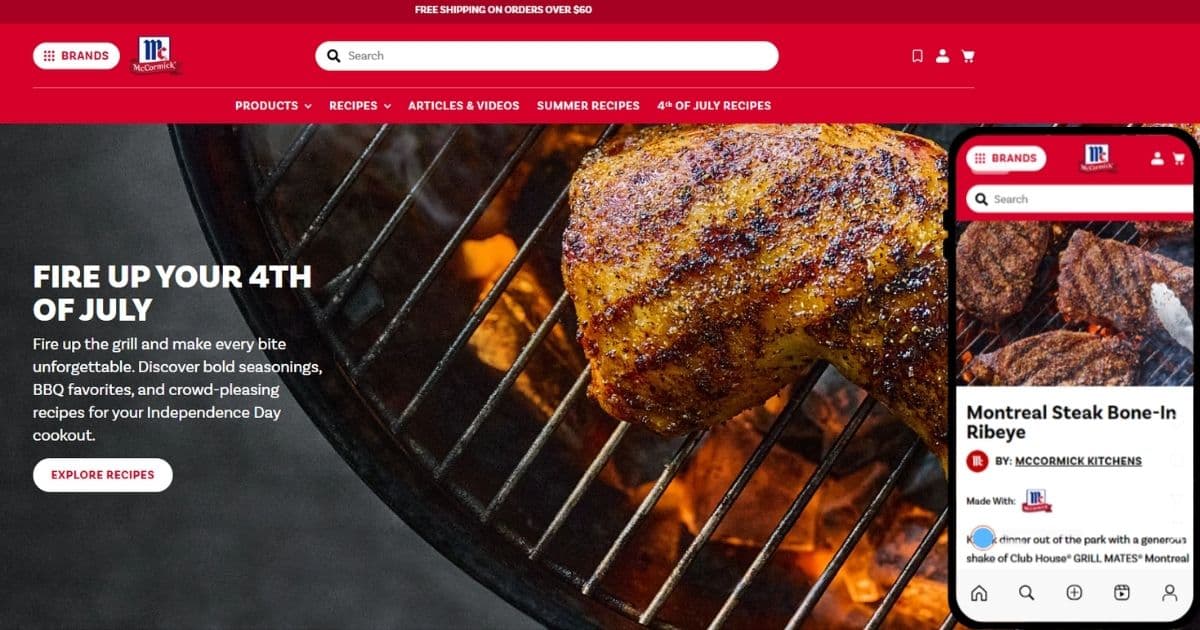
+143%
Speed Improvement
McCormick & Company
Within one sprint cycle, desktop Google PageSpeed Insights score rose from 35 to 85 — a 143% improvement. Mobile score moved from below 40 to 75. C...
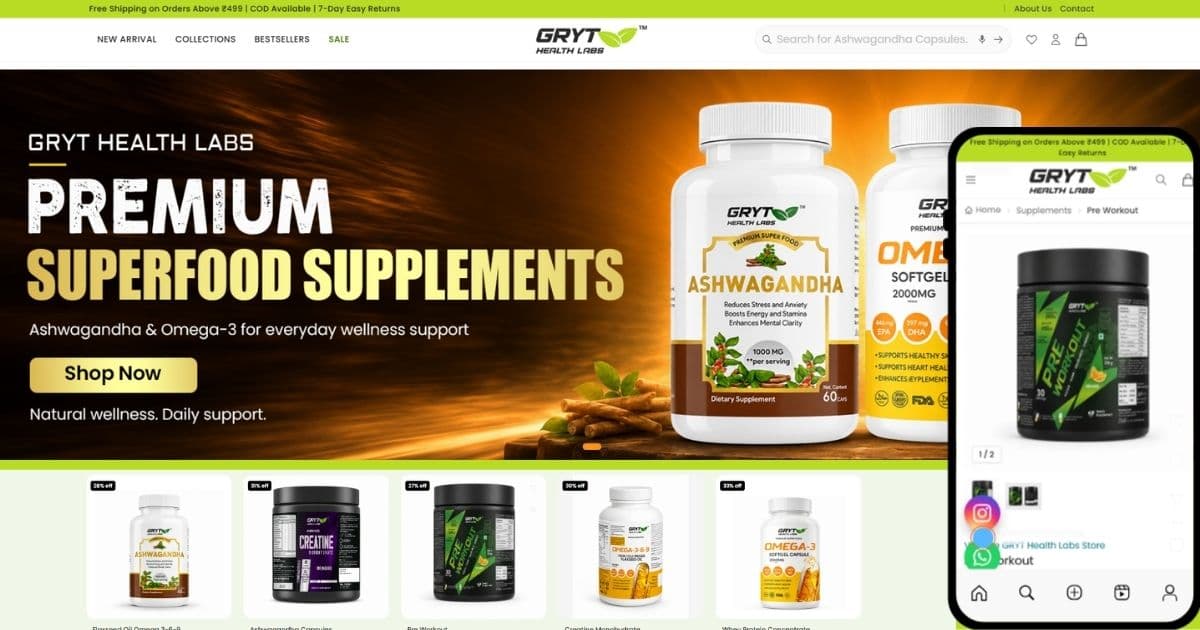
24h
Order dispatch
GRYT Health Labs
The launched site reads as a focused, conversion-first shop rather than a catalogue dump. Because it is a custom Laravel build, the cart, checkout...
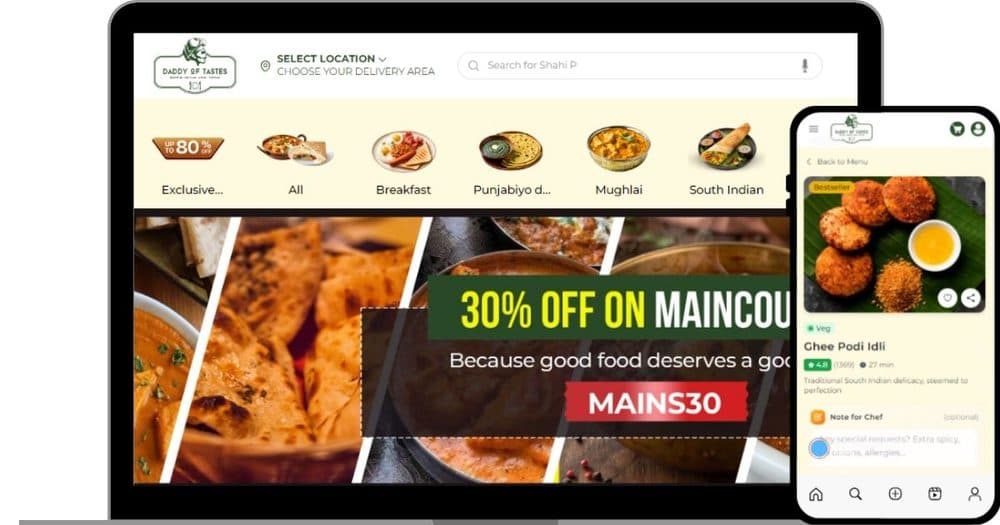
Daddy of Tastes
The launched storefront gives customers a quick path from category to dish detail to cart, with offers and ratings visible where they aid the decis...
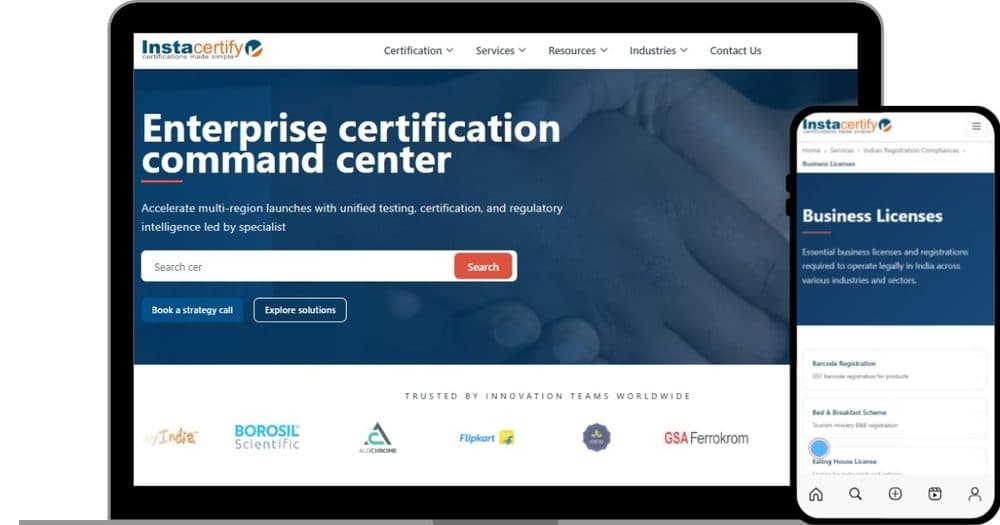
Instacertify
The site reads as a single command center for certification, with search and clear calls to action giving buyers an obvious first step. The card-dr...
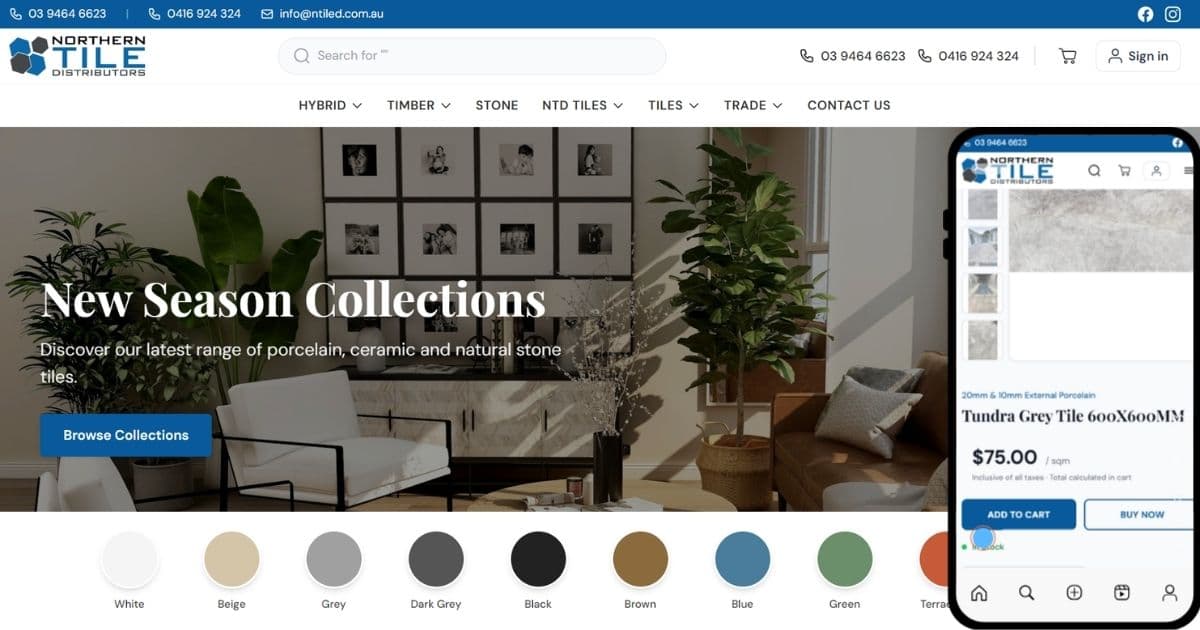
Northern Tile Distributors
The storefront gives Northern Tile Distributors a clean way to present deep tile and timber ranges so builders can scan collections quickly and che...
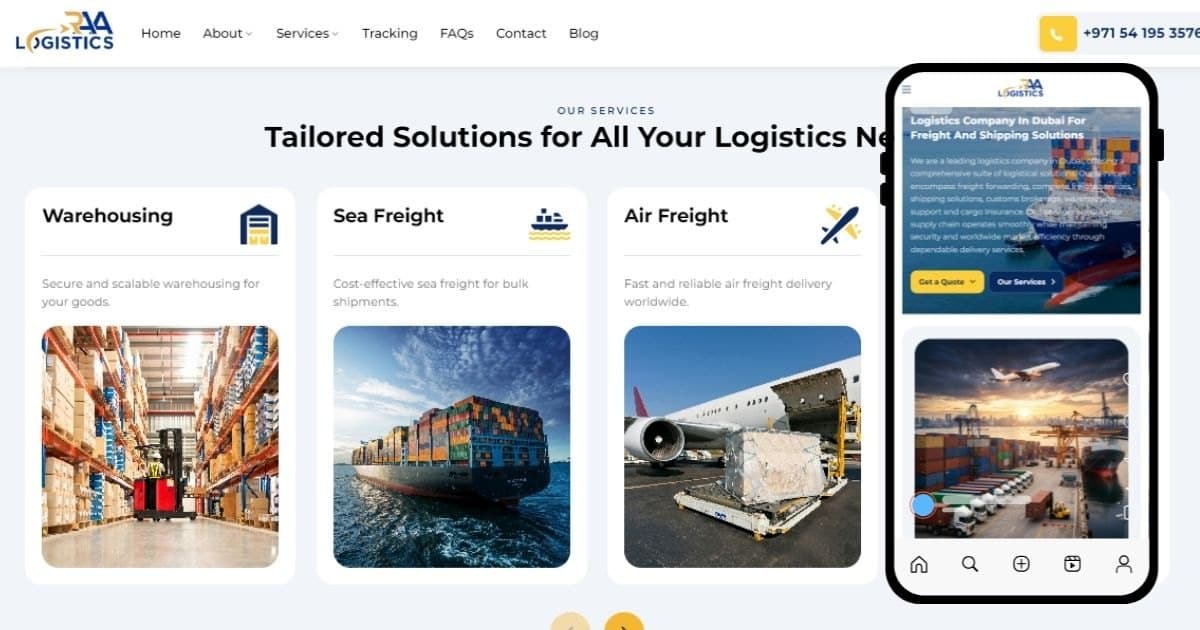
Raa Logistics
The launched site gives Raa Logistics a clean, professional presence that reads well on both desktop and phones, with the quote request and trackin...
Why Dcrayons

Paid-media specialists
We run Google, Meta, Amazon and LinkedIn campaigns for real brands, so this comparison matches how budgets actually perform, not a vendor pitch.

Senior strategist on every account
No junior media buyers learning on your budget. The strategist who plans your channel mix stays on it.

Media plan in one business day
A written channel plan and budget split inside 24 hours. Most agencies take a week of discovery; that week is wasted spend.

CFO-readable numbers
Weekly cadence and a monthly readout tied to ROAS and cost per lead. A report you can hand to your CFO without translation.

The right channel mix is worth more than any single platform.
Dcrayons runs Google, Meta, Amazon and LinkedIn campaigns for growing brands: media planning, campaign build, creative and reporting under one weekly roadmap. This comparison uses the same planning model our team runs on real budgets.
Ad-platform comparison questions, answered
The real questions brands ask before choosing where to spend their ad budget. No jargon, no vendor pitch.
It depends on your objective, industry and offer. Google captures high-intent search, Amazon converts ready-to-buy shoppers, Meta drives reach and retargeting, and LinkedIn reaches B2B decision-makers. Use the comparison above with your budget and order value to see which is estimated to return the most for your case. The benchmarks are illustrative and vary widely, so treat the ranking as directional.
Neither is universally better. Google Ads captures people already searching for your product, so intent is high; Meta Ads reaches people who are not searching yet but can be persuaded, often at a lower cost per click. Many brands run both: Google to harvest demand, Meta to create it. The tool lets you compare the estimated numbers side by side for your budget.
They are directional, not guarantees. The cost-per-click and conversion-rate benchmarks are illustrative India averages and your real results depend heavily on your industry, offer, creative, targeting and account quality. Use the comparison to weigh channels, then validate with a small real test campaign before scaling.
Most growing brands use a mix, matched to objective: search for intent, social for reach and retargeting, marketplaces for product sales. Start where the estimated efficiency and your objective line up, prove it works, then expand. The comparison helps you decide where to start rather than spreading a small budget too thin.
No. Everything runs in your browser. Nothing you type is sent to Dcrayons or any ad platform, and nothing is stored, so you can plan real budgets without any privacy concern.
Want your budget on the right platform?
Our team can plan your channel mix, build the campaigns and produce the creative so your ad spend actually returns.